Pourquoi cela compte
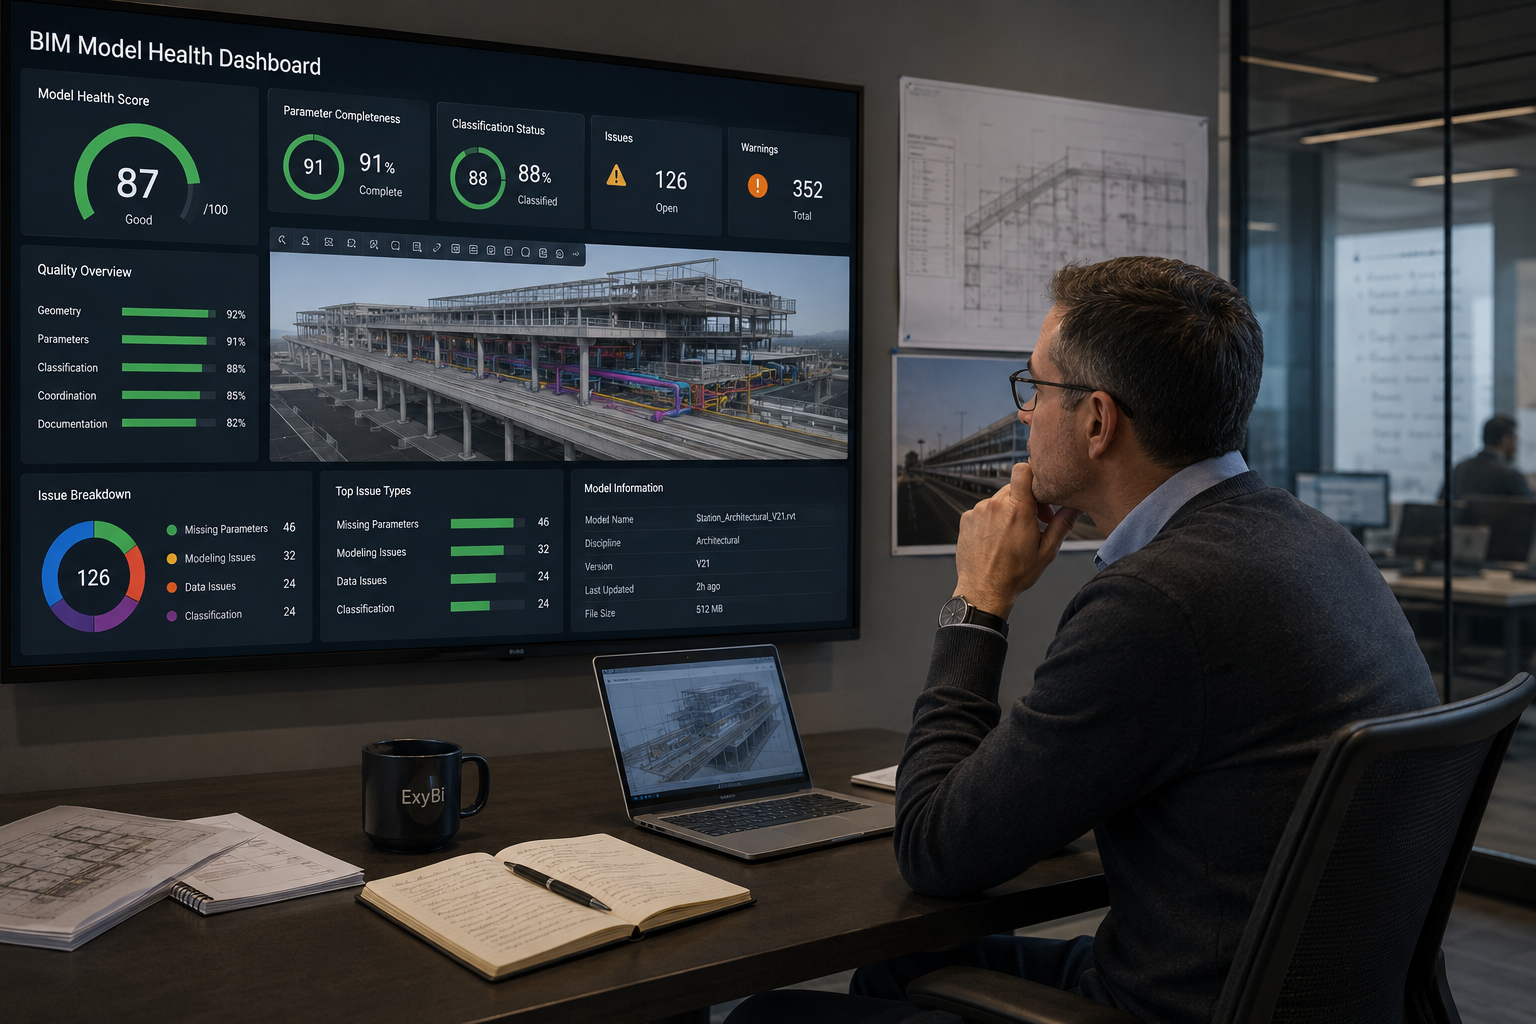
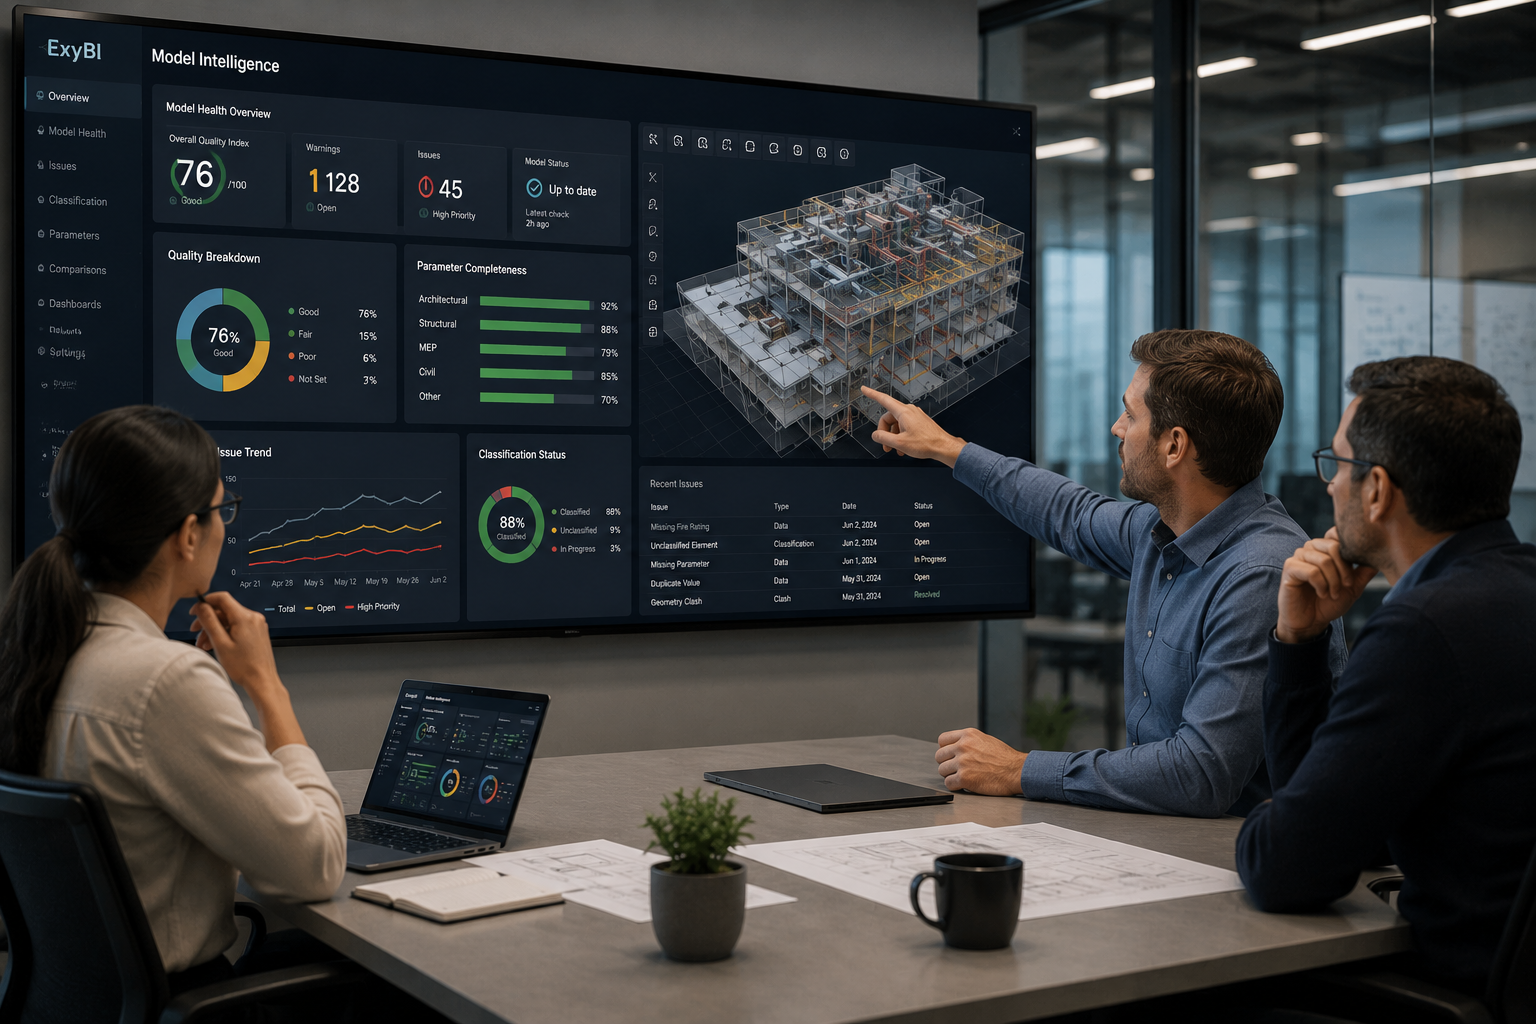
Large infrastructure and rail projects need model governance that can be seen, questioned, and repeated. A dashboard gives the BIM manager a shared operating picture instead of another disconnected report attachment.
Section 1
Why model problems need to be visible earlier
BIM managers are often expected to protect model quality while the project is moving faster than the checking cycle. Discipline teams issue models, consultants update packages, coordinators ask for federated exports, and management wants a clean statement of progress. The difficulty is that many model problems do not look dramatic at first. A missing classification code, an inconsistent level value, or a family with weak shared parameters can sit quietly in the model until it blocks reporting, quantities, IFC exchange, or package comparison.
The traditional response is to run checks, export a spreadsheet, mark up screenshots, and discuss exceptions in a meeting. That can work on a small package with a stable team. It becomes much weaker on corridor-scale work, station programs, depot projects, or multidisciplinary infrastructure packages where many teams are producing data at different levels of maturity. By the time the spreadsheet is cleaned and circulated, the source model may already have moved on.
A BIM manager does not need a dashboard because dashboards are fashionable. The need is more basic. The manager needs to see whether the model is fit for the next project decision. Are required parameters filled? Are warnings increasing? Are classifications consistent enough for grouping? Are elements ready for quantity review? Are IFC-related properties present before export? Without that visibility, model governance becomes dependent on memory, manual sampling, and the confidence of whoever spoke last in the meeting.
- Manual exports are snapshots, while model quality keeps changing.
- Screenshots show symptoms, but they rarely explain the data pattern behind the symptom.
- Meeting updates depend on interpretation, while dashboards can expose the underlying model signals.
Section 2
How dashboards support daily BIM manager routines
A useful BIM dashboard starts with the questions a BIM manager already asks. Which discipline has the highest number of unresolved warnings? Which package has the weakest parameter completion? Which systems are missing classification? Which model version introduced a change in quantities or object counts? Which areas are ready for coordination and which are still too immature to include in a formal review?
ExyBI supports that workflow by moving Revit model data into a reporting layer that can be read in Power BI and connected to visual review through ExyViewer. The value is not that every user becomes a data analyst. The value is that BIM leadership can stop rebuilding the same evidence each week. Model data becomes a set of tables and signals that can be filtered by discipline, package, type, level, zone, classification, workset, or other project-specific fields.
In daily work, that gives the BIM manager a more disciplined rhythm. Before a coordination meeting, the dashboard can show where model health is improving or declining. Before an IFC exchange, it can highlight whether the required data is present. Before a management report, it can separate actual model progress from optimistic status language. The model still needs technical judgment, but the discussion starts from evidence rather than scattered exports.
- Use model-health views to identify weak packages before federation.
- Use parameter-completion views to focus consultant feedback on the fields that matter.
- Use classification and quantity views to prepare more credible reporting conversations.
Section 3
What the BIM manager gets in practice
In practice, the dashboard becomes a control surface for model quality. It can show warning counts by model and category, missing required parameters by discipline, classification completeness by package, element counts by level or asset zone, model versions by publish date, and quantity movements that deserve review. Those views do not replace detailed model checking. They help the BIM manager decide where detailed checking should be focused.
This is especially important in rail and infrastructure work because the model is rarely a neat single building file. It may be a chain of stations, track areas, civil packages, structures, systems, temporary works, and asset data requirements. A dashboard gives the BIM manager a way to compare those parts without opening every model and manually rebuilding the same view of readiness.
ExyBI should be understood as a reporting and visibility layer. It takes useful signals from Revit and makes them available to Power BI and ExyViewer workflows so BIM managers can see quality patterns, discuss them with discipline leads, and keep governance connected to the actual model state. It does not remove the need for BIM standards, checking rules, or team accountability. It makes those things easier to manage because the evidence is visible.
- Model health: warnings, object counts, categories, versions, and package readiness.
- Data quality: missing values, inconsistent parameters, classification gaps, and IFC preparation signals.
- Management output: clearer weekly reporting, more focused coordination agendas, and better evidence for consultant follow-up.
Points d’action
- BIM managers need model-quality evidence before project pressure turns small data gaps into visible delivery problems.
- Dashboards help focus checking effort on the models, parameters, and packages that need attention.
- ExyBI connects Revit model signals to Power BI and ExyViewer so model governance is easier to see and repeat.
Point de réalité
- A dashboard is only useful if the project agrees which parameters, classifications, and checks actually matter.
- Poor source-model discipline still has to be fixed in the authoring workflow; ExyBI makes the problem visible rather than pretending it has disappeared.
Commandes et fonctions liées
ExyBI
Revit publishing, Power BI dashboards, ExyViewer context
Make model quality visible before the review meeting
ExyBI gives BIM teams a practical way to publish model data, health signals, quantities, and visual context into dashboard workflows built for repeated review.
Explore ExyBI